Archive: Costlier Living


Interest Rates and the Affordability of Housing
This an archive copy of a post that originally ran on Substack back in September of 2023
Everything has grown more expensive, but housing costs in particular have skyrocketed. Per FRED data, in 2020 the median home sold for ~$337K. By the end of 2022, that price had ballooned by 35% to ~$457K (Q4 specifically was ~$480K). Renters meanwhile are also facing substantial pressure, with some economists estimating that median rents have increased by as much as 25% in the last four years. The supply shocks caused by Russia’s invasion of Ukraine in February of 2022 drove prices higher across the economy, but particularly in food and energy. Historically low unemployment in the U.S. has kept the labor market tight, with the corresponding increases in labor costs passed on to consumers. All of these factors combined to drive inflation to levels not seen since the 1990s.
In March of 2022 the Federal Reserve began raising interest rates in order to tame/slow inflation and stabilize the economy. How does that actually help you may ask? Without getting fully in the weeds, raising rates makes borrowing more expensive, which is supposed to make the consumer less inclined to finance purchases, and thereby spend less overall. That reduced demand should then in turn put downward pressure on prices (Econ 101 supply/demand) and reduce inflation. Our society runs on debt, which means that interest rates impact everything, but Jerome Powell was right to refer to them as a “blunt instrument.” While higher rates are supposed to reduce demand, the impacts will not be immediate in all sectors of the economy. In fact, many businesses can only respond to a demand slowdown after it has already begun and every product category will not respond the same. While there is no clear answer on how long it takes for rate increases to impact overall inflation, by nature of their product, mortgage lenders will can adjust their rates almost immediately. As data will show however, costlier mortgages have not necessarily equaled lower home prices.
There’s the old saying that “comparison is the thief of joy.” If you’ve recently looked at a mortgage calculator, a totally normal thing that people do… and fall into either of these two camps, you likely feel very little joy right now:
- You bought or refinanced during the historically low rates brought on by pandemic monetary policy and now feel “trapped” by rates that are more than 2x higher.
- You’d like to buy, but the rise in rates has now pushed that goal even more out of reach, while at the same time, rising rents are limiting your ability to save for a down payment.
Nationally the first two quarters of 2023 did show consecutive decreases to median sales price versus the 2022 full year median, but are still 20% higher than 2020. When zooming in on specific states, metro areas, or neighborhoods, prices may not have gone down at all. Let’s dive into how much the equation has shifted for both current and prospective buyers.
“Trapped”
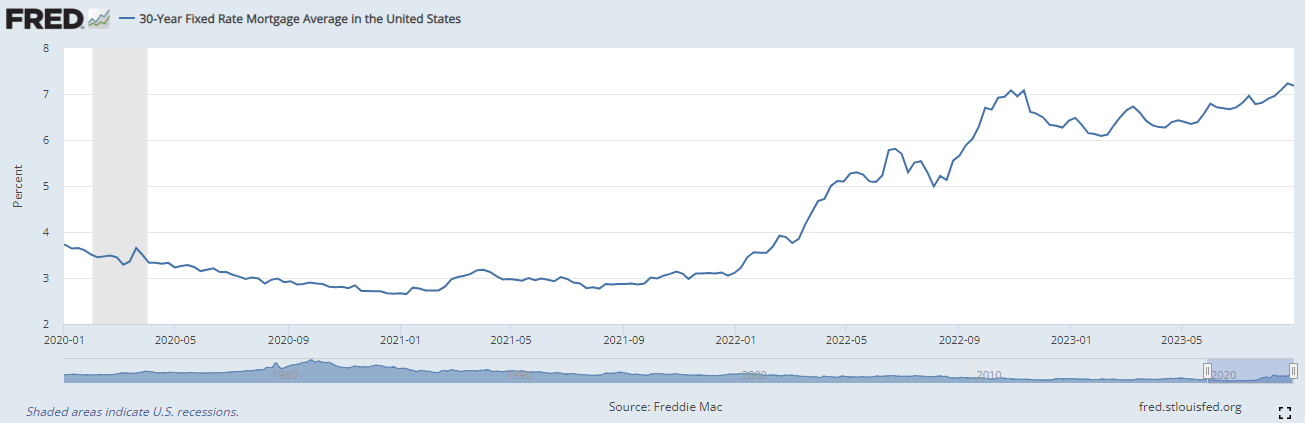
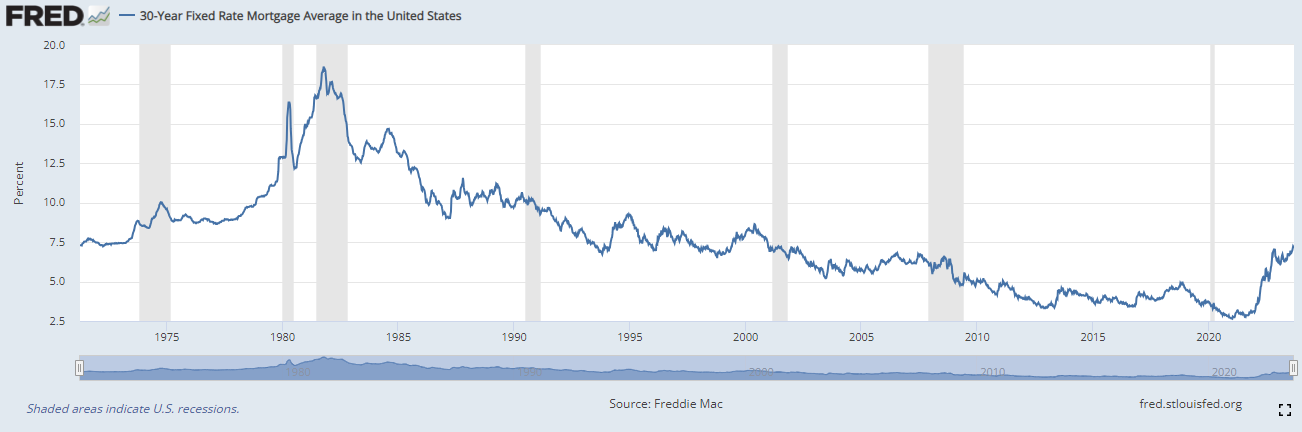
In the fall of 2020, 30-year fixed rate mortgages were going for as low as 2.50%. At the end of August 2023, the average 30-year fixed was being priced at 7.18% and likely over 8% for those with lower credit scores. While those trying to become first-time buyers likely feel very little sympathy for current homeowners, the brutal swing in mortgage math for anyone considering to sell is undeniable.
Note: The following examples are all going to assume 30-year fixed rate mortgages since those are what most people are familiar with and easy to model. It is true that high rate mortgage holders could have the opportunity to refinance in the future and reduce their payments, but how when that will make financial sense is largely unknown.
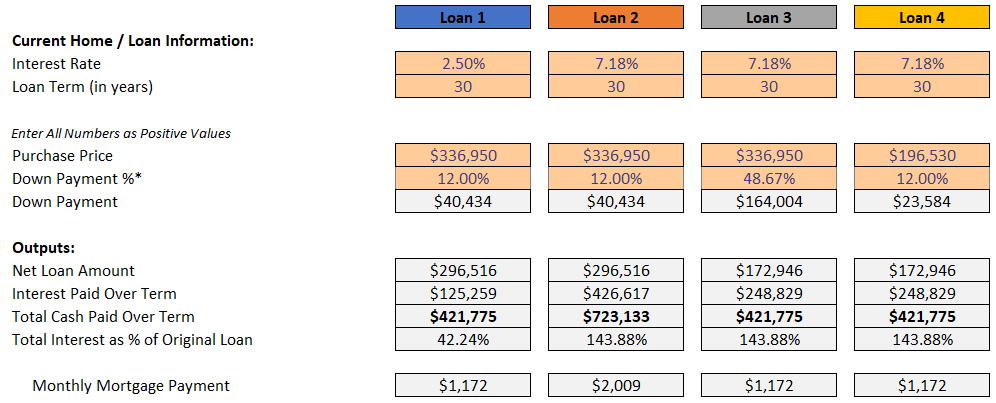
Per FRED, the median home in the U.S. sold for $336,950 in 2020. Median down payments for all buyers have been in the low teens for the several years and for this initial example we’ll use 12%.

All else equal (see Figure 1), the ~2.9x change in interest rate increases the monthly mortgage payment by 71%. More eye-popping is the impact in interest paid over the term of the loan, which balloons by 3.4x and represents paying ~144% of the original principal in interest vs only ~42% at the previous low rates. Depending on how much these low-rate buyers stretched their budgets to begin with, buying even a similarly priced home might now be impossible without putting in substantially more money on top of their existing equity.

In order to achieve the same monthly mortgage payment at today’s rates for home that is exactly the same price the buyer would need to make a down payment of almost 50% (see Figure 2). Even with that substantially larger down payment the total interest paid remains almost double. Said another way and using the original monthly payment as our target, a buyer that could put 12% down on a home costing ~$337K, can now only afford a house priced at ~$197K (see Figure 3).
These initial examples haven’t included the fact that despite rising rates, median prices haven’t really gone down. While the 2020/2021 homebuyer will have realized some appreciation on their property, if monthly payment is the primary concern in the decision to sell/move then that upside is effectively meaningless.
A key to remember is that while a home is a vehicle for wealth creation and stability, the options for tapping into that price appreciation are limited in the short-to-medium term. None of the upside is truly “real” / liquid until you either downsize or exit homeownership completely later in life.
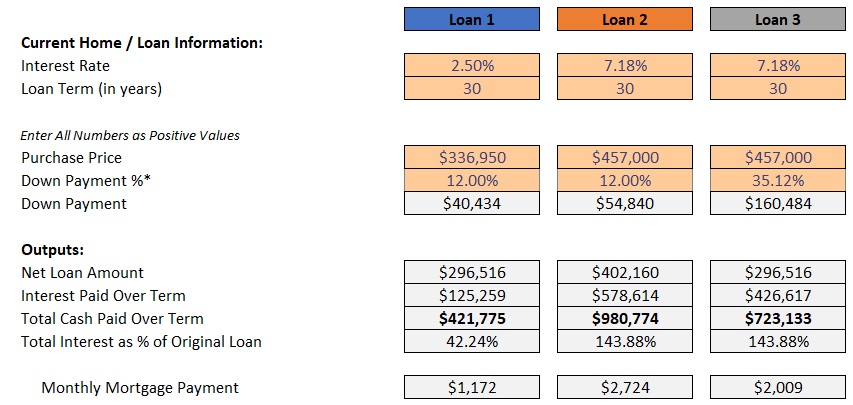
Looking at Figure 4 below, Loan 3 takes the original down payment in Loan 1 (~$40K) and adds on the increase in median sale price from 2020 to 2022 (~$120K) for a net down payment of ~35%. Even if the owner were to then buy another home priced at the 2022 median, the monthly payment still goes up by 71% despite having a down payment of over $160K. You may have noticed that the payment increase outlined in Figure 4 is the same as the one described in Figure 1. This progression of scenarios shows that buyers can construct any combination of purchase price and down payment they wish so long as a bank would then approve the mortgage. The final loan amount and corresponding monthly payment is what ultimately matters.
Prices Staying High
Thinking back to supply and demand, interest rates are supposed to blunt demand by making debt more expensive. Despite the sizable increases in the cost of borrowing, the data shows housing prices are still rising. We need to look at the supply side of the equation for much of our answer.
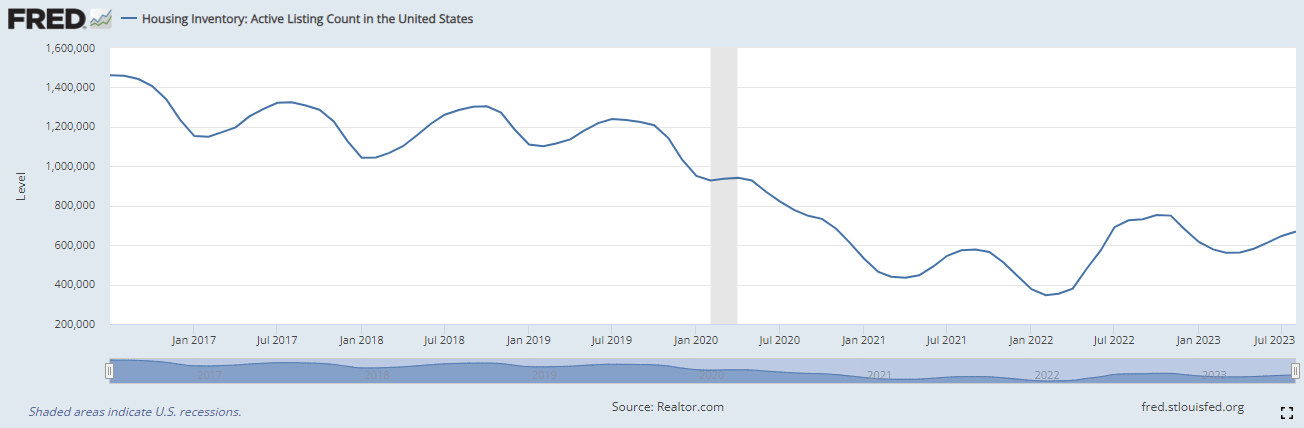
According to a Zillow survey published at the of July, “…about 80% of mortgage holders reported having a rate of less than 5%, and about 90% have a rate of less than 6%. Almost one-third reported a rate of less than 3%.” While there are many homeowners who might like to sell their homes for any number of reasons, the math we’ve reviewed shows why that might not be possible for many of them. Even if they aren’t explicitly concerned about the long term interest costs they’d incur by accepting a higher rate, the bigger monthly payments are simply unworkable. The substantial number of mortgages at these lower rates is greatly impacting the number of active listings. For those that do have the money, low inventory will mean bidding wars that keep prices high. While the FRED dataset below only goes back to mid-2016, the inventory shortfall since the pandemic is crystal clear.
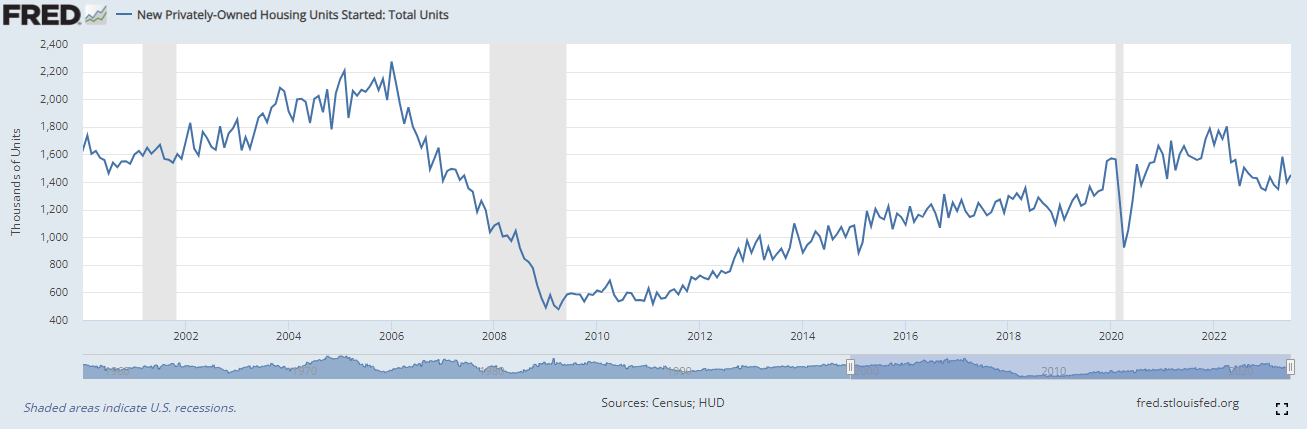
The other factor on the inventory/supply side is new housing starts. Capping nearly 15 years of positive growth, 2006 had the highest number of housing starts since mid 1980s. That was then followed by a Great Recession slide that reached all-time lows for a FRED dataset that goes all the way back to 1959. Starts have been recovering ever since, but much like interest rates themselves, the impact of those lean years will ripple far into the future. Despite the high rate environment, if low inventory remains persistent then prices are likely to stay high in many metros unless an actual recession were to occur.
Renting Forever
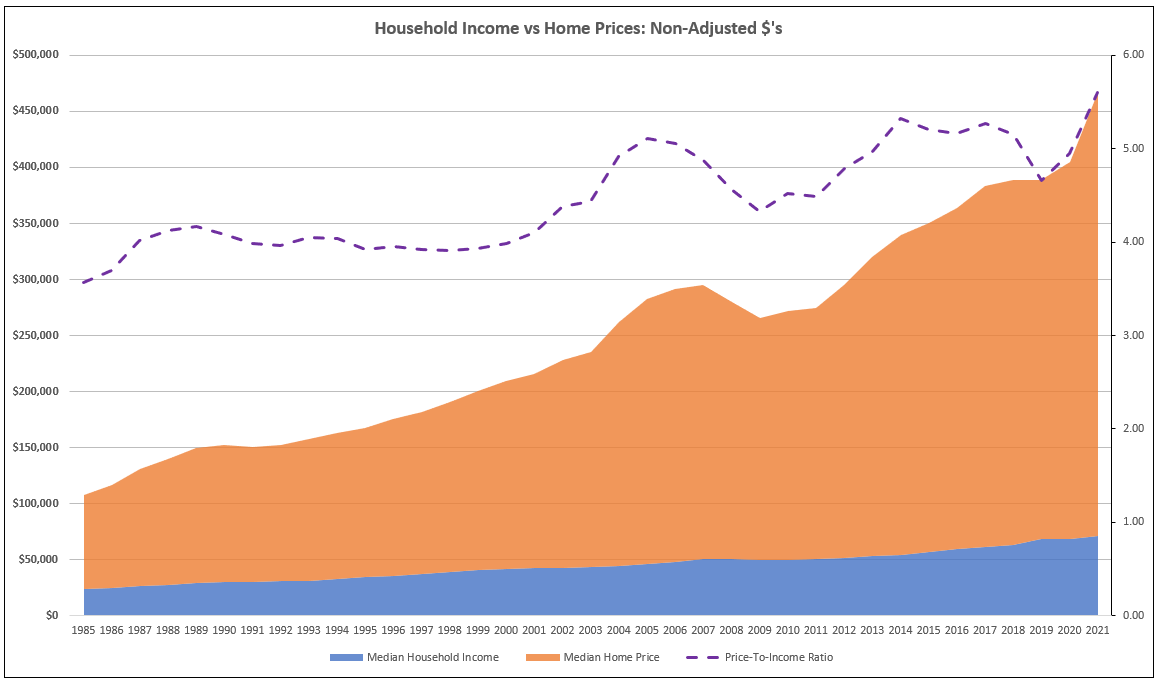
While the median price increases since 2020 have been severe, getting on the housing ladder in general has become more difficult in the last twenty plus years. One way to prove that statement is to compare Median Household Income and Median Home Price. Calculating a ratio between the two is one way to track housing affordability. Beginning in 1985, after several years of increase the ratio narrowed and then remained steady for the whole of the 1990s. Since 2000 however, growth in home prices has outpaced income growth. While 2022 annual data was not available for both metrics it seems highly likely that the ratio pushed even higher. Comparing 1985 to 2021, median income had a compound annual growth rate (CAGR) of 3.1% whereas median home price increased 4.4%. Looking at CAGRs for 2000 to 2021, income grew by only 2.5% while prices went up by 4.2%. As prices outgrow income, the more difficult homeownership becomes in turn. Further confirming this assessment, a recent piece in Axios mentions a Goldman Sachs index that calculates housing affordability at a record low dating back to 1997 (inclusive of interest rates, wages, and housing prices).
The supply issue discussed previously also limits options for first time homebuyers. According to a CNBC article from July citing both Zillow and Census data, only 11% of homes sold in Q1-2023 went for below $300K, while traditionally defined starter homes were selling for $180K as of May 2023.
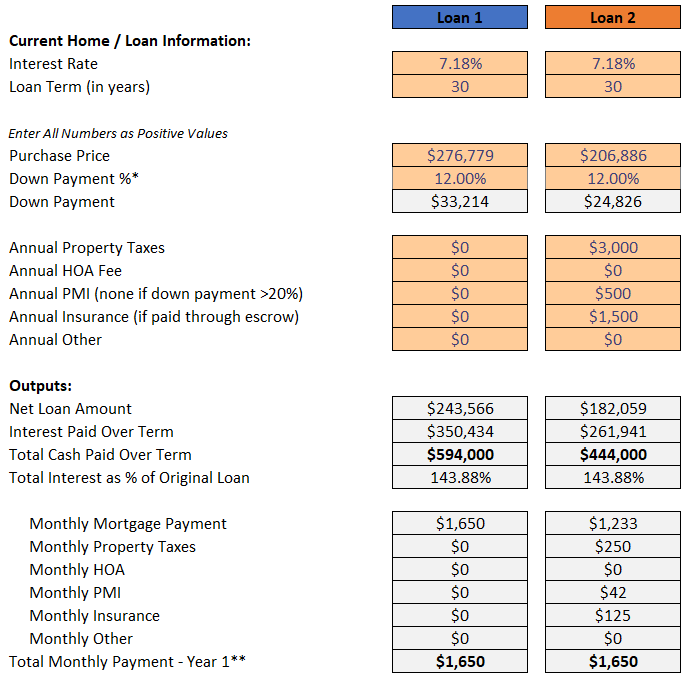
Using the 28% DTI rule as a guide, a hopeful first time homebuyer at the median household income for 2021 of $70,784 could afford a mortgage payment inclusive of property taxes and insurance of ~$1650.
$70,784 / 12 = $5899 monthly pre-tax income x 28% = $1650
If the entire $1650 could be applied to principal and interest, the buyer could purchase a $276K home at the interest rate and down payment used in our prior examples. While property taxes and insurance can vary significantly state-to-state, using plausible values drops the max purchase price to ~$207K to adhere to the total payment of $1650. Remembering that only 11% of homes sold in Q1-2023 were below $300K, the purchase options for the median income household are SLIM. Single income buyers at the median are likely priced out most properties.
No Easy Answers
Given The Fed’s concerns on inflation, rate cuts are unlikely for at least the rest of the year if not further in 2024. If and when the first cut does come, the impact will likely be given ample time to cycle through the economy. While mortgages over 7% are not a historical anomaly, the bulk of mortgages currently being well below that means it will likely take several rate cuts before meaningful amounts of sellers re-enter the fray.
It seems clear that addressing this problem on the supply side and via housing policy is the only answer. History however has made it very clear that any efforts to materially increase housing, affordable or otherwise, will be met with stiff resistance from existing owners fearful about their own property values. If we want to create a world where more families can thrive, then we need to stop thinking about housing as a zero-sum game.


